Let’s break down the five critical takeaways to remember when confronted with the age-old question, “So, what is programmatic advertising, exactly?” One of the biggest: integrate ads with content to grow revenue with no audience churn.

Overview: What is Programmatic Advertising — 5 Key Takeaways for publishers, by publishers
At Flexpress, our partners are expert publishers, and we’re inspired by them. Popular Science, Outdoor Life, and Field & Stream alone boast more than four hundred years of brand experience. Our goal with this “What is programmatic advertising” guide is to bring publishers up to speed using plain English about how programmatic advertising works, the benefits that it can provide, and the pitfalls to avoid.
The authors of this post have personally worked in digital publishing for more than sixty combined years. When done well, programmatic advertising serves as one of the levers at the publisher’s disposal to rapidly increase revenue alongside audience. When done poorly, previously loyal visitors never come back and new visitors never find the content via Search.
We created this companion slide deck so you can follow along.
Key Takeaway #1 — Programmatic advertising revenue is a math formula with two variables
Programmatic advertising revenue =
[# of ad slots the audience sees] x
[price advertisers are willing to pay to appear in a given ad slot]
- The # of ad slots on a site is commonly referred to as “inventory”;
- You can have a lot of ads on the page, but if nobody sees them, you won’t monetize
- Ad unit measurement = an “impression” = number of consumer views of an ad
- Price dictated according to near-instantaneous competitive bidding between programmatic advertisers
- Go to popsci.com and see an example of a programmatic ad in the footer; when I just went to the site, the programmatic advertiser was Mailchimp (shout out to the MailChimp Content Style guide).
Mailchimp uses programmatic ads to earn sign-ups from popsci.com’s audience
- Net / Net
Publishers can boost programmatic advertising revenue in 2 ways: either the number of viewable impressions (either by increasing the number of ads or the number of people on a page), or the amount advertisers pay per viewable impression.
Key Takeaway #2 — Programmatic advertising auctions take place billons of times per day, in near real-time
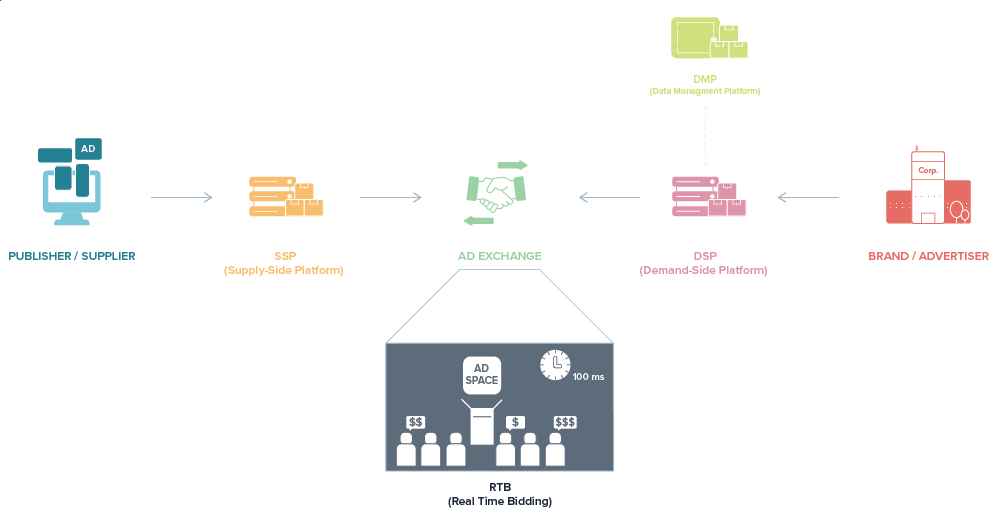
Understanding the programmatic advertising real-time auction

Hand drawing / schematic showing the value chain for programmatic advertising
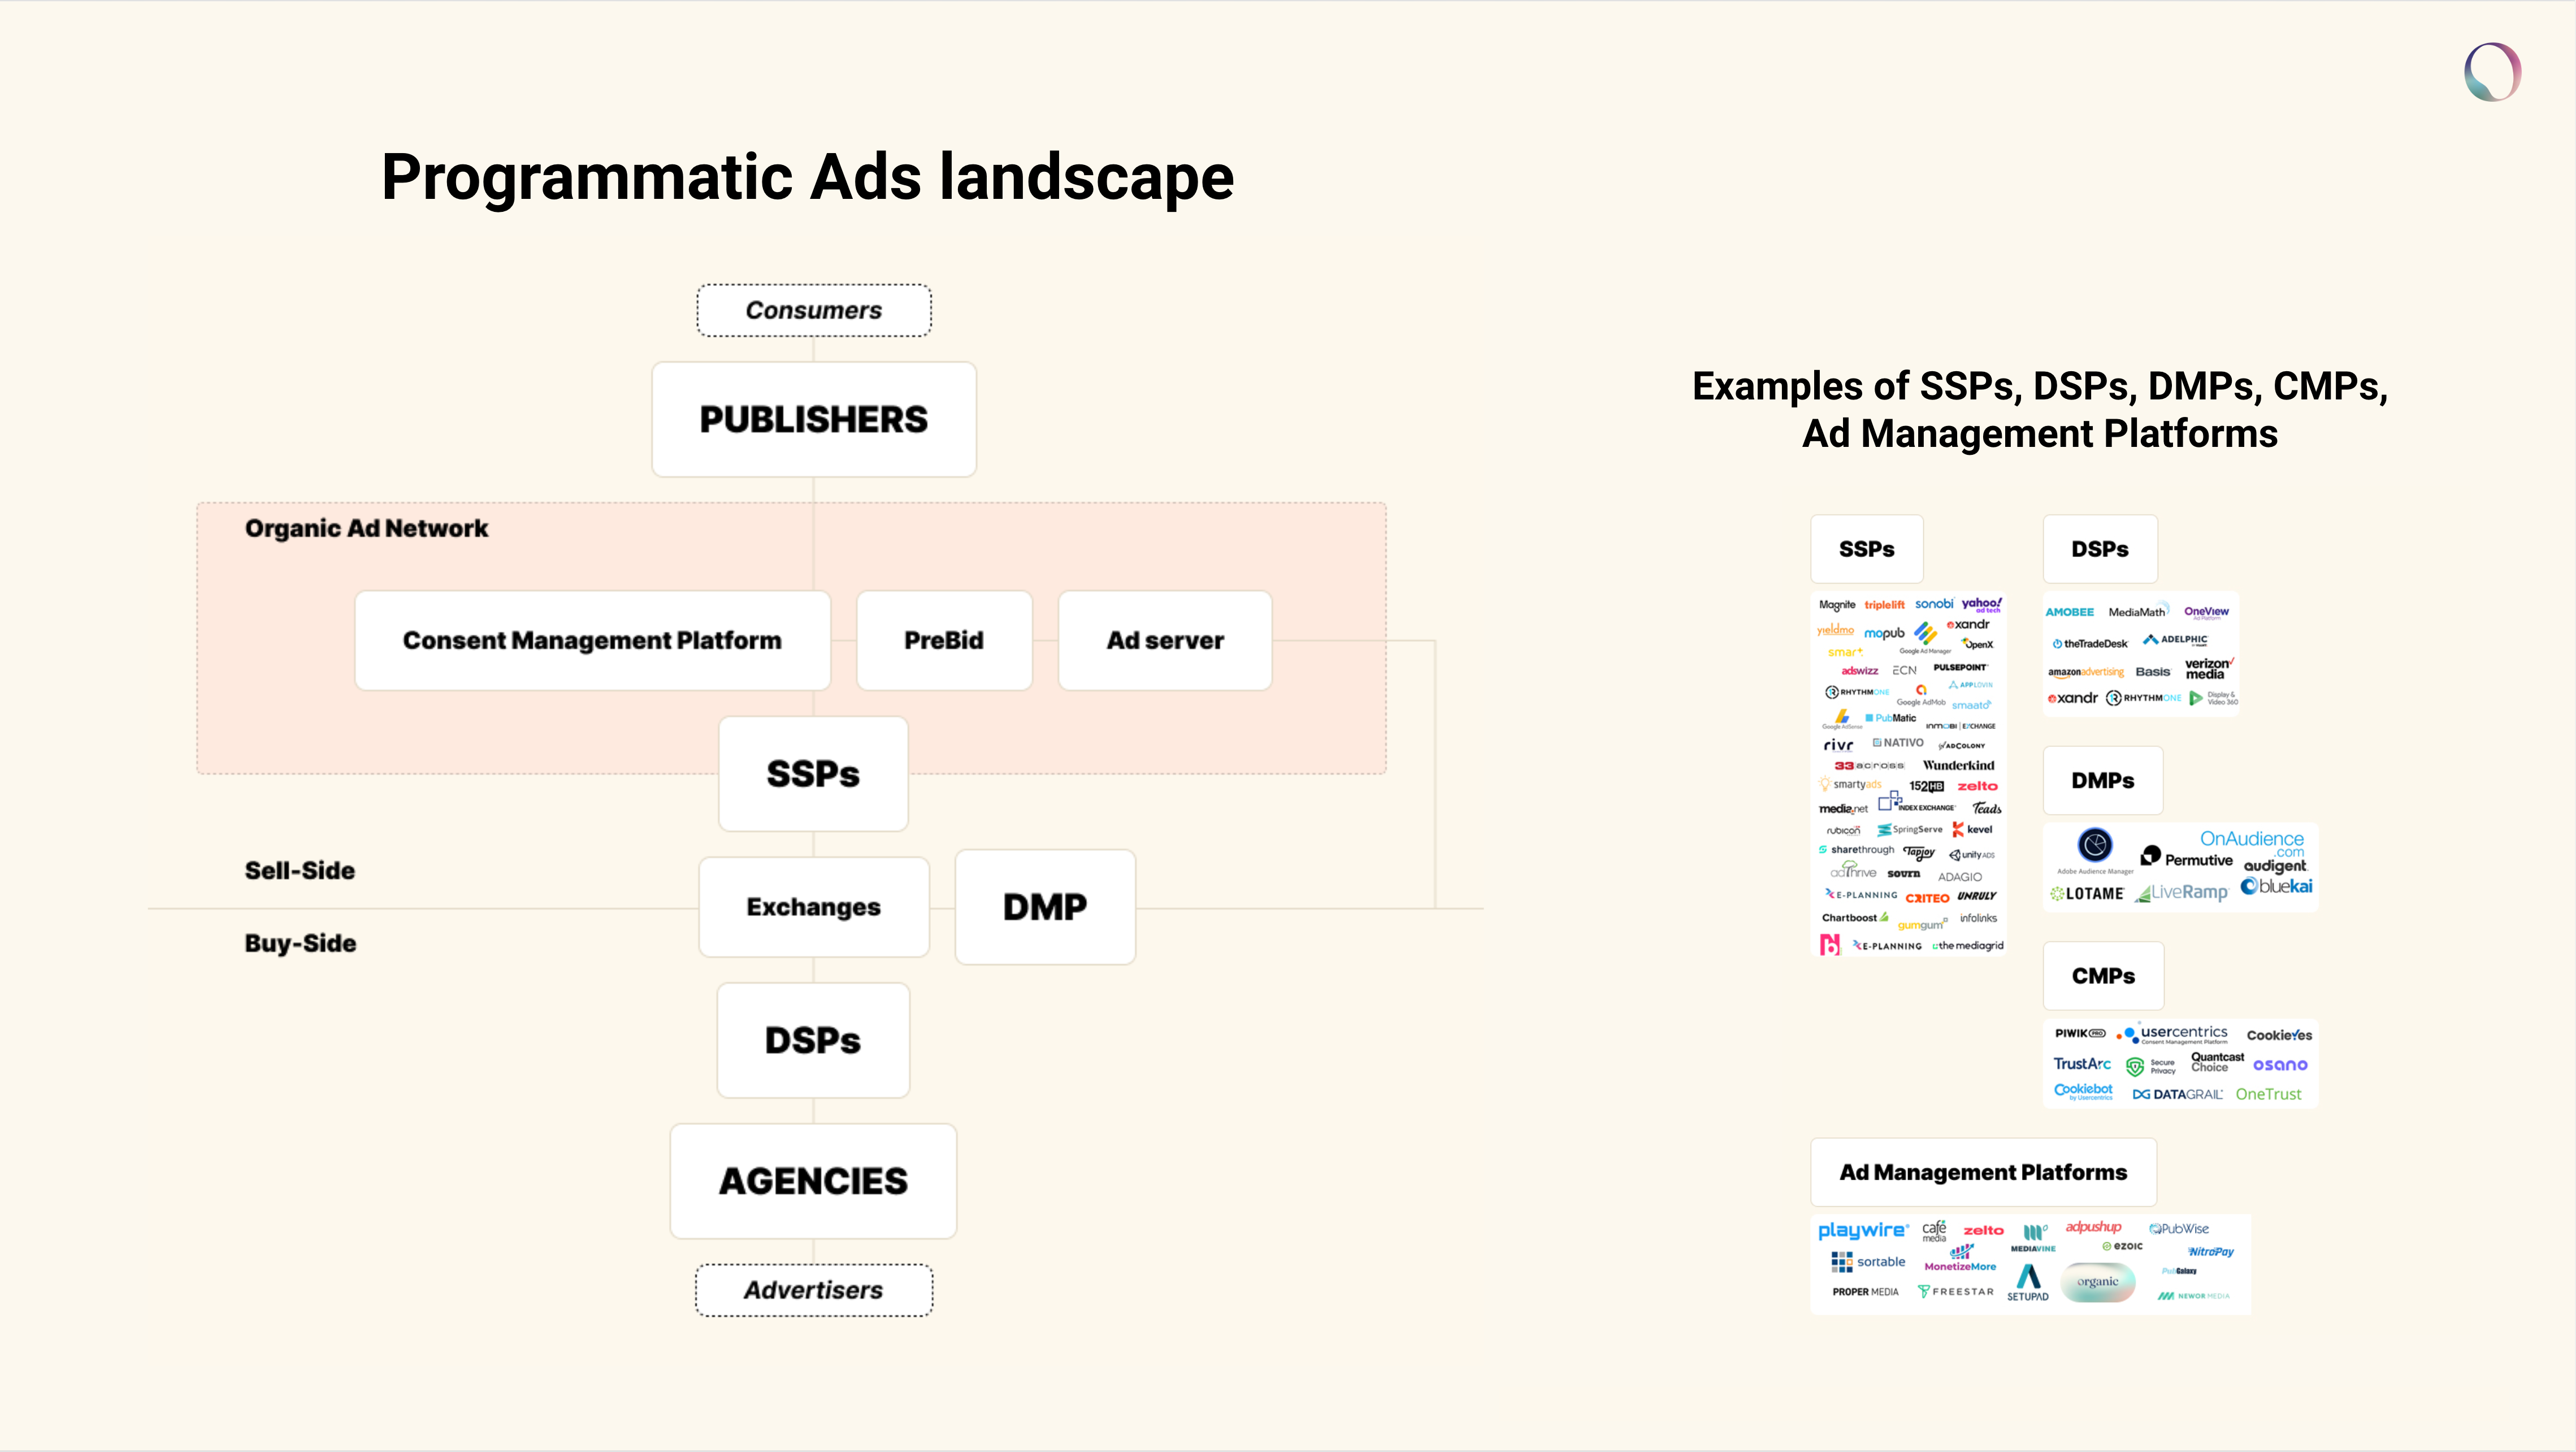
Outside of the publisher (supply), and advertiser (demand), there are three other links in the chain that that makes the auction process work:
- Supply (or Sell) Side Platforms (SSPs): Tech that manages ad inventory, such as Google AdX, OpenX, Pubmatic, etc.
- Demand Side Platforms (DSPs): Advertiser technology that sets parameters (e.g. audience demographics) to automate bidding on ad inventory
- Ad Exchange: The marketplace where SSPs and DSPs meet to conduct auctions
Suppliers build technology to connect publishers to SSPs — and that technology creates value by managing these technical connections (uptime), lowering barriers for publisher entry (user experience), and/or optimizing configurations to earn the highest amount for a given inventory (integrated content + ads design).

In this Agency Holding Map by Eskimi, industry world, notice how companies generally work directly with the Advertisers, and then feed into Demand Side Partners (DSPs) or Private Marketplace (PMP) deals
Key Takeaway #3: Learn the interplay between the key metrics CPM, RPM, & RPS to track performance
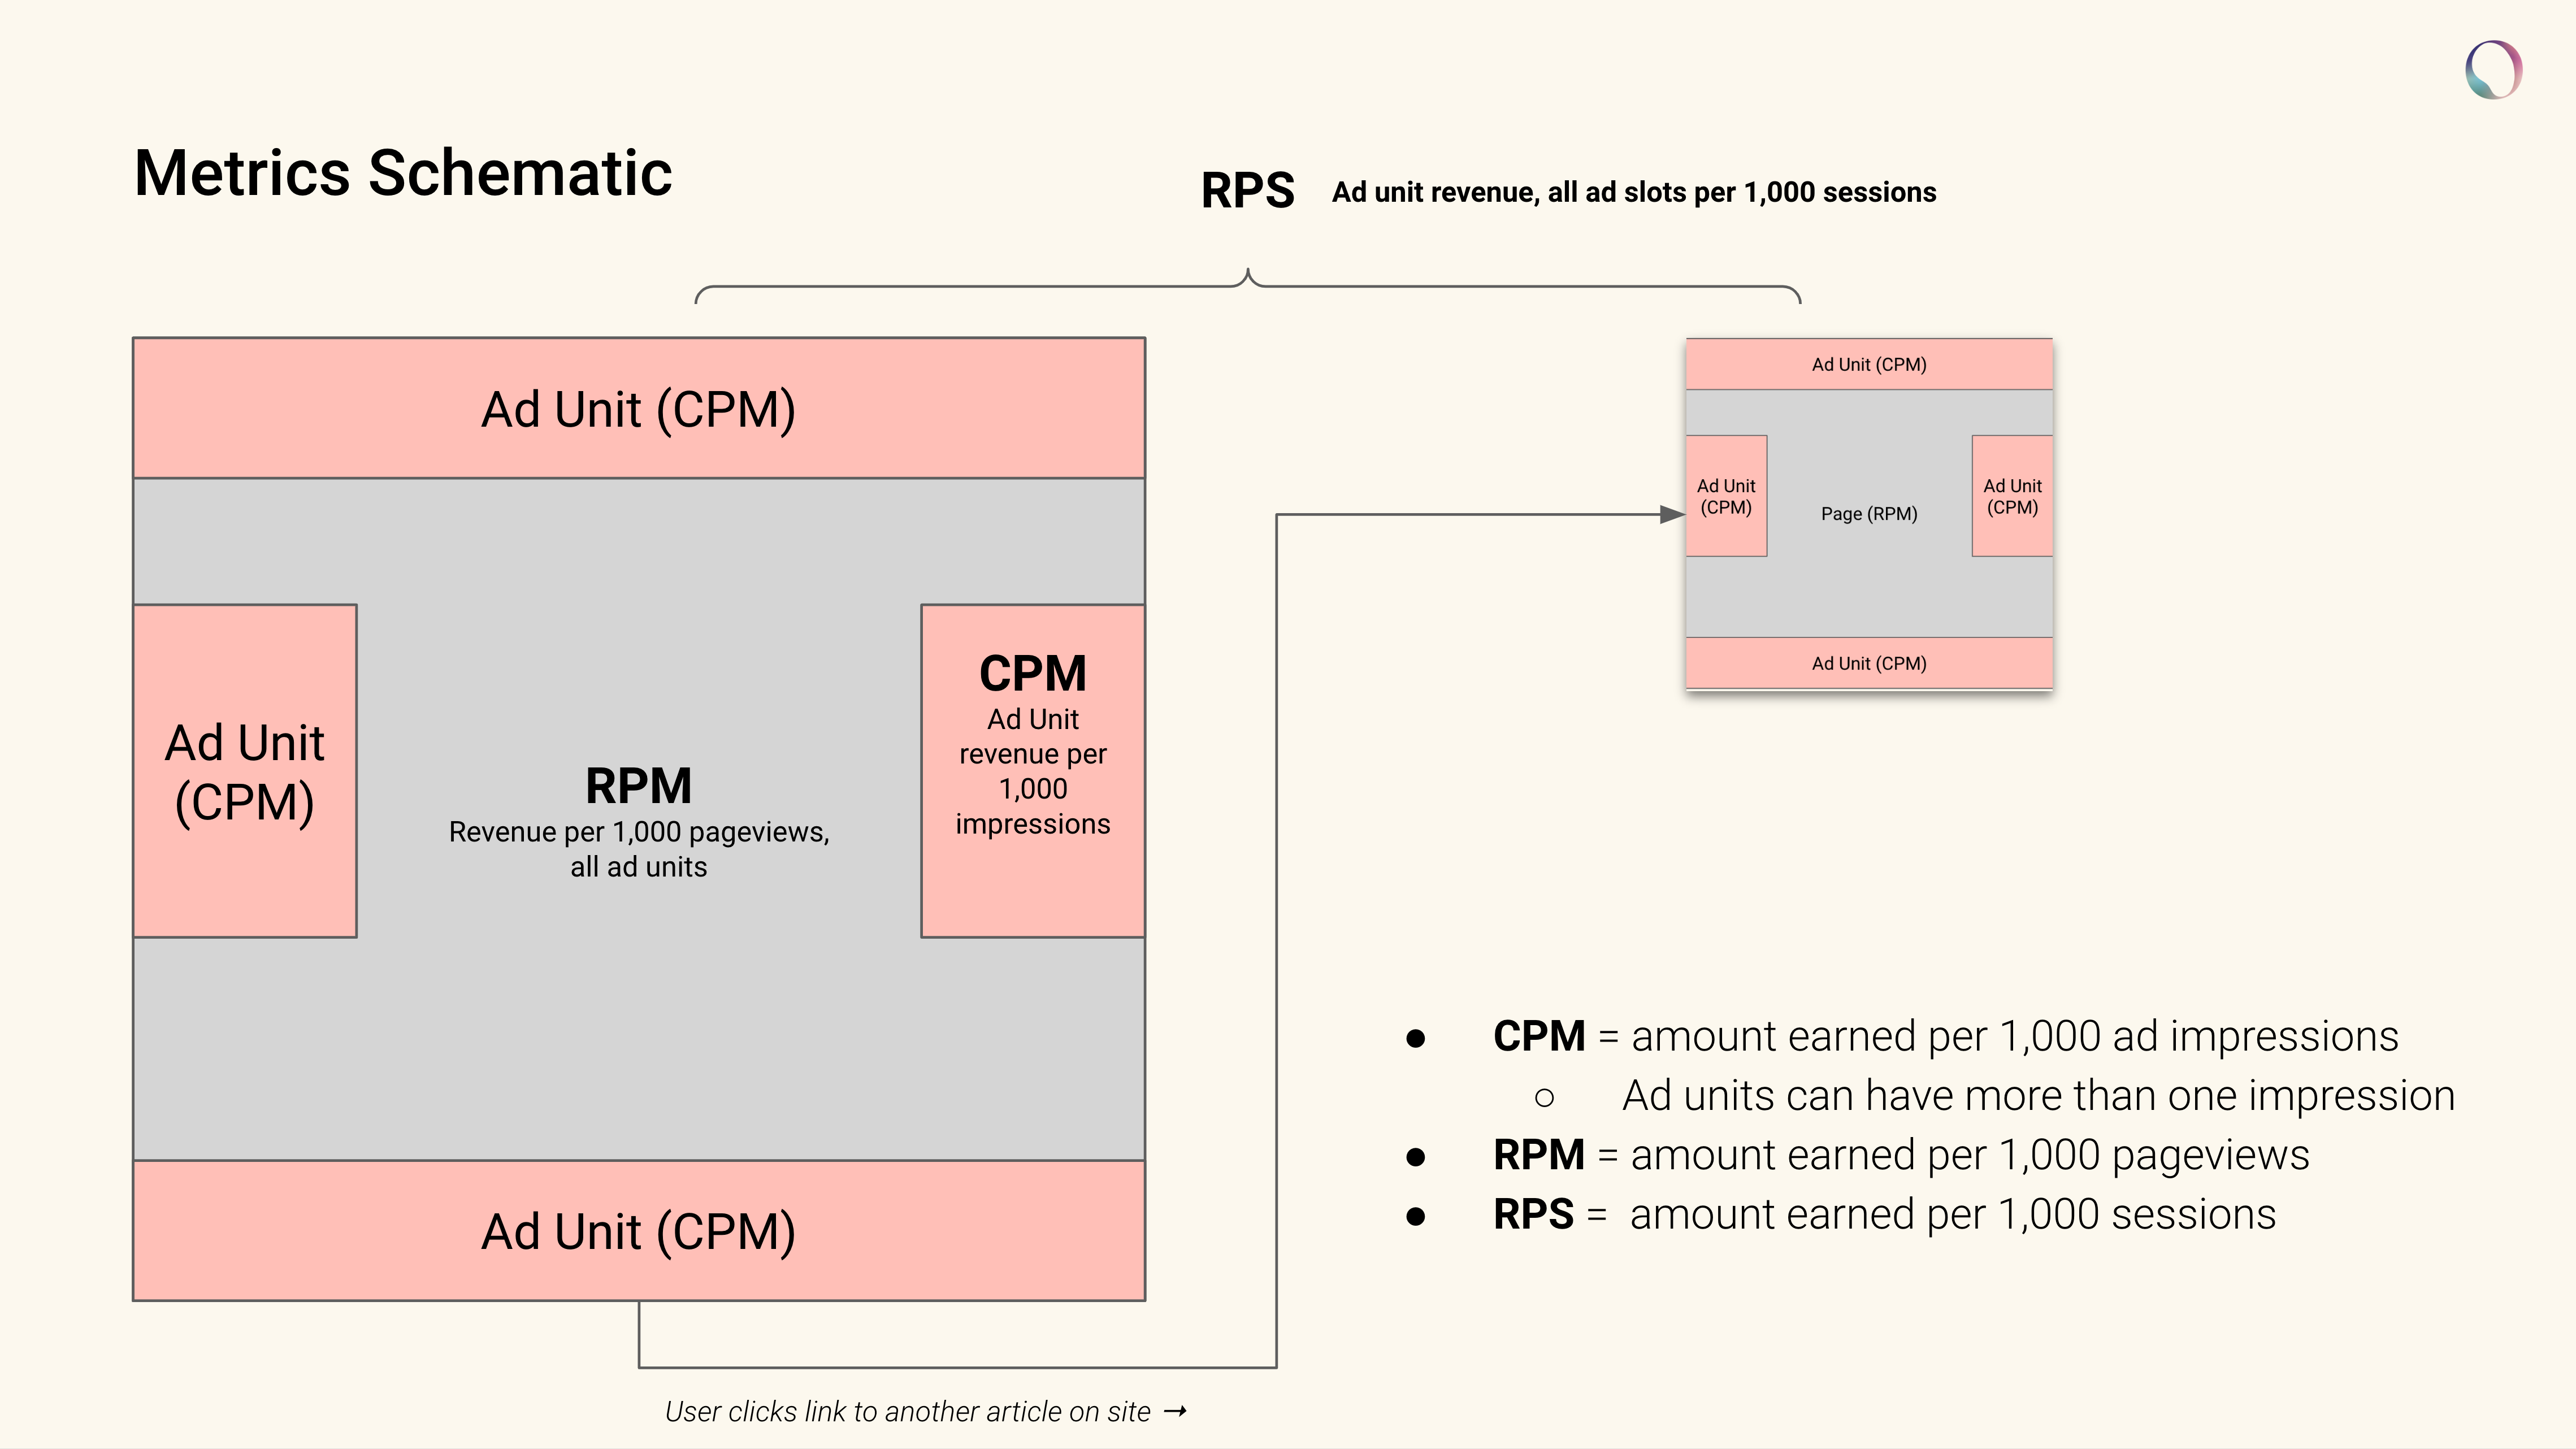
CPM = revenue earned from 1,000 impressions of one viewable ad slot;
RPM = revenue earned from all viewable ad slots per 1,000 pageviews;
RPS = revenue from all viewable ad slots per 1,000 sessions.

Hand drawing illustrating the interplay between CPM, RPM, and RPS
You can learn more about what it is publishers are doing to manipulate CPM, RPM, RPS, and other programmatic advertising metrics in this article: Engineering Analysis: How Programmatic Advertising Companies Affect Publisher Revenue, but for fun let’s do a brain teaser —>
You see on your site that CPMs are down while RPS remains up;
what should you do?
—————
-
- Well, likely pageviews are up as well. This would be one way for it to be true that individual advertising slots are earning less while total earnings for each visit to the site continues to climb.
- More pageviews are generally good for publishers, so ¡Yay!, but also check ad density and bounce rate. Could be that there are too many ads on the page, or that slideshow-like content experiences need a refresh.
|
Definition |
Calculation |
|
|
Gross Ad Revenue |
Ad revenue earned before revenue share/fees NB: publishers never / rarely see this number |
You can back into this calculation: |
|
Net Ad Revenue |
Money earned by the publisher after all revenue share/fees are deducted |
For flat-fee providers: |
|
CPM or eCPM |
Cost per thousand impressions; the amount an advertiser is spending to purchase 1,000 ad impressions on a given site |
Total [Net ad slot revenue / impressions] * [1,000] |
|
RPM |
Revenue per thousand pageviews; amount a publisher earns for every 1,000 views of a single page on a given site over a set time period |
Total [Net ad revenue / pageviews] *[ 1,000] |
|
RPS |
Revenue per thousand sessions; a “session” is essentially a “visitor” and thus this amount reflects publisher earnings from ads for every 1,000 visitors on the site |
Total [Net ad revenue / sessions] * [1,000] |
This table has specific definitions, as well as calculations to understand what is programmatic advertising, and how you can measure the performance of Ads
Diving deeper into CPM, RPM, and RPS
- CPM
-
- CPM measures the performance of an individual ad unit
- NB: “CPM” is the same as “Impression RPM”
- CPM reflects how much advertisers “value” the ad space
- CPM blends display and video; video generally earns 2-5x display CPMs
- Let’s calculate a CPM:
- CPM measures the performance of an individual ad unit
-
-
-
- Total Ad Revenue: $10,000
- Total Ad Impressions: 10,000,000
- CPM = ?
$1.00
-
-
-
- Keep in mind, these are the finite factors that impact CPM:
-
-
- Competition for inventory (e.g. number of SSPs bidding, specific SSPs)
- Audience demographics (i.e. data), site reputation, “vertical” focus
- Device type (desktop, mobile, tablet)
- Ad view-ability (can it be seen?)
- Ad size, quality, placement, type (e.g. display vs. video)
- Optimization strategies (bid floors, inventory supply & demand)
- Macroeconomic factors (advertising budgets, seasonality)
-
- RPM
-
- For some, it’s helpful to think of RPM as the sum of all the CPMs for every 1,000 pageviews
- Provides a better measure of actual revenue the site is earning
- Measures performance of how well a publisher monetizes traffic
-
-
- Again, there are a finite number of factors that impact RPM:
-
-
-
-
- The site’s CPM
- Number of ad units on the page
- Number of impressions shown across the ad units (e.g. refresh rates)
- Content quality and engagement (e.g. time on page)
- “Fill rate” of impressions; the higher fill rate, the more you earn
- Fill Rate is % of total inventory that advertisers purchase;
- Some advertisers allocate unused inventory to sustainability or other environmental causes, as oftentimes 15% or more can go unused
-
-
- RPS
-
- RPS measures the ability to monetize a site visitor – this is a very important metric, but often overlooked
-
- Analogy 1: you are in a grocery store
- CPM = the amount you spend on a box of cereal
- RPM = the amount you spend in the breakfast aisle
- RPS = the amount you spend when you check out of the grocery store
- Analogy 2: you are driving home in traffic between San Francisco and Oakland
- CPM = the amount earned from 1,000 views of one billboard
- RPM = the amount earned from 1,000 views of all the billboards over the stretch of gridlocked highway in San Francisco
- RPS = the amount earned from 1,000 gridlocked drives, which include billboard earnings in both San Francisco and Oakland
- Analogy 1: you are in a grocery store
-
- RPS measures the ability to monetize a site visitor – this is a very important metric, but often overlooked
Key Takeaway #4: Use the drivers of CPM, RPM, and RPS to uncover opportunities to create incremental revenue
By monitoring the below KPIs (“key performance indicators) that drive CPM, RPM, and RPS, publishers can learn how to earn more revenue while encouraging return visits in the future.
|
Definition |
What does it impact |
|
|
Viewability |
The % of impressions that are actually seen (or viewed) |
Advertisers use viewability to assess the quality of the ad stack and value of the CPM. |
|
Fill Rate |
The % of available ad impressions filled by advertisers |
Better fill rates = more revenue. You want to sell all the inventory you have. |
|
Page Load Speed |
How long (seconds) it takes a page to load |
User experience impacts return visits, total time spent on site, and pageviews per session. |
|
Session Duration |
How long a visitor is on the site |
Longer session durations provide greater monetization opportunities, e.g. via ad refreshes after thirty seconds or so of on-site time |
|
Page Views / Session |
The number of pages a visitor goes to, on average, during a visit |
More page views = more ad loads and revenue per session. |
|
Bounce Rate |
The % of visitors who visit one page and then leave the site |
Lower bounce rates = more ad loads and revenue per session |
|
Impressions / Pageview |
The average number of impressions shown per pageview |
More ad impressions = more revenue, higher RPM and RPS |
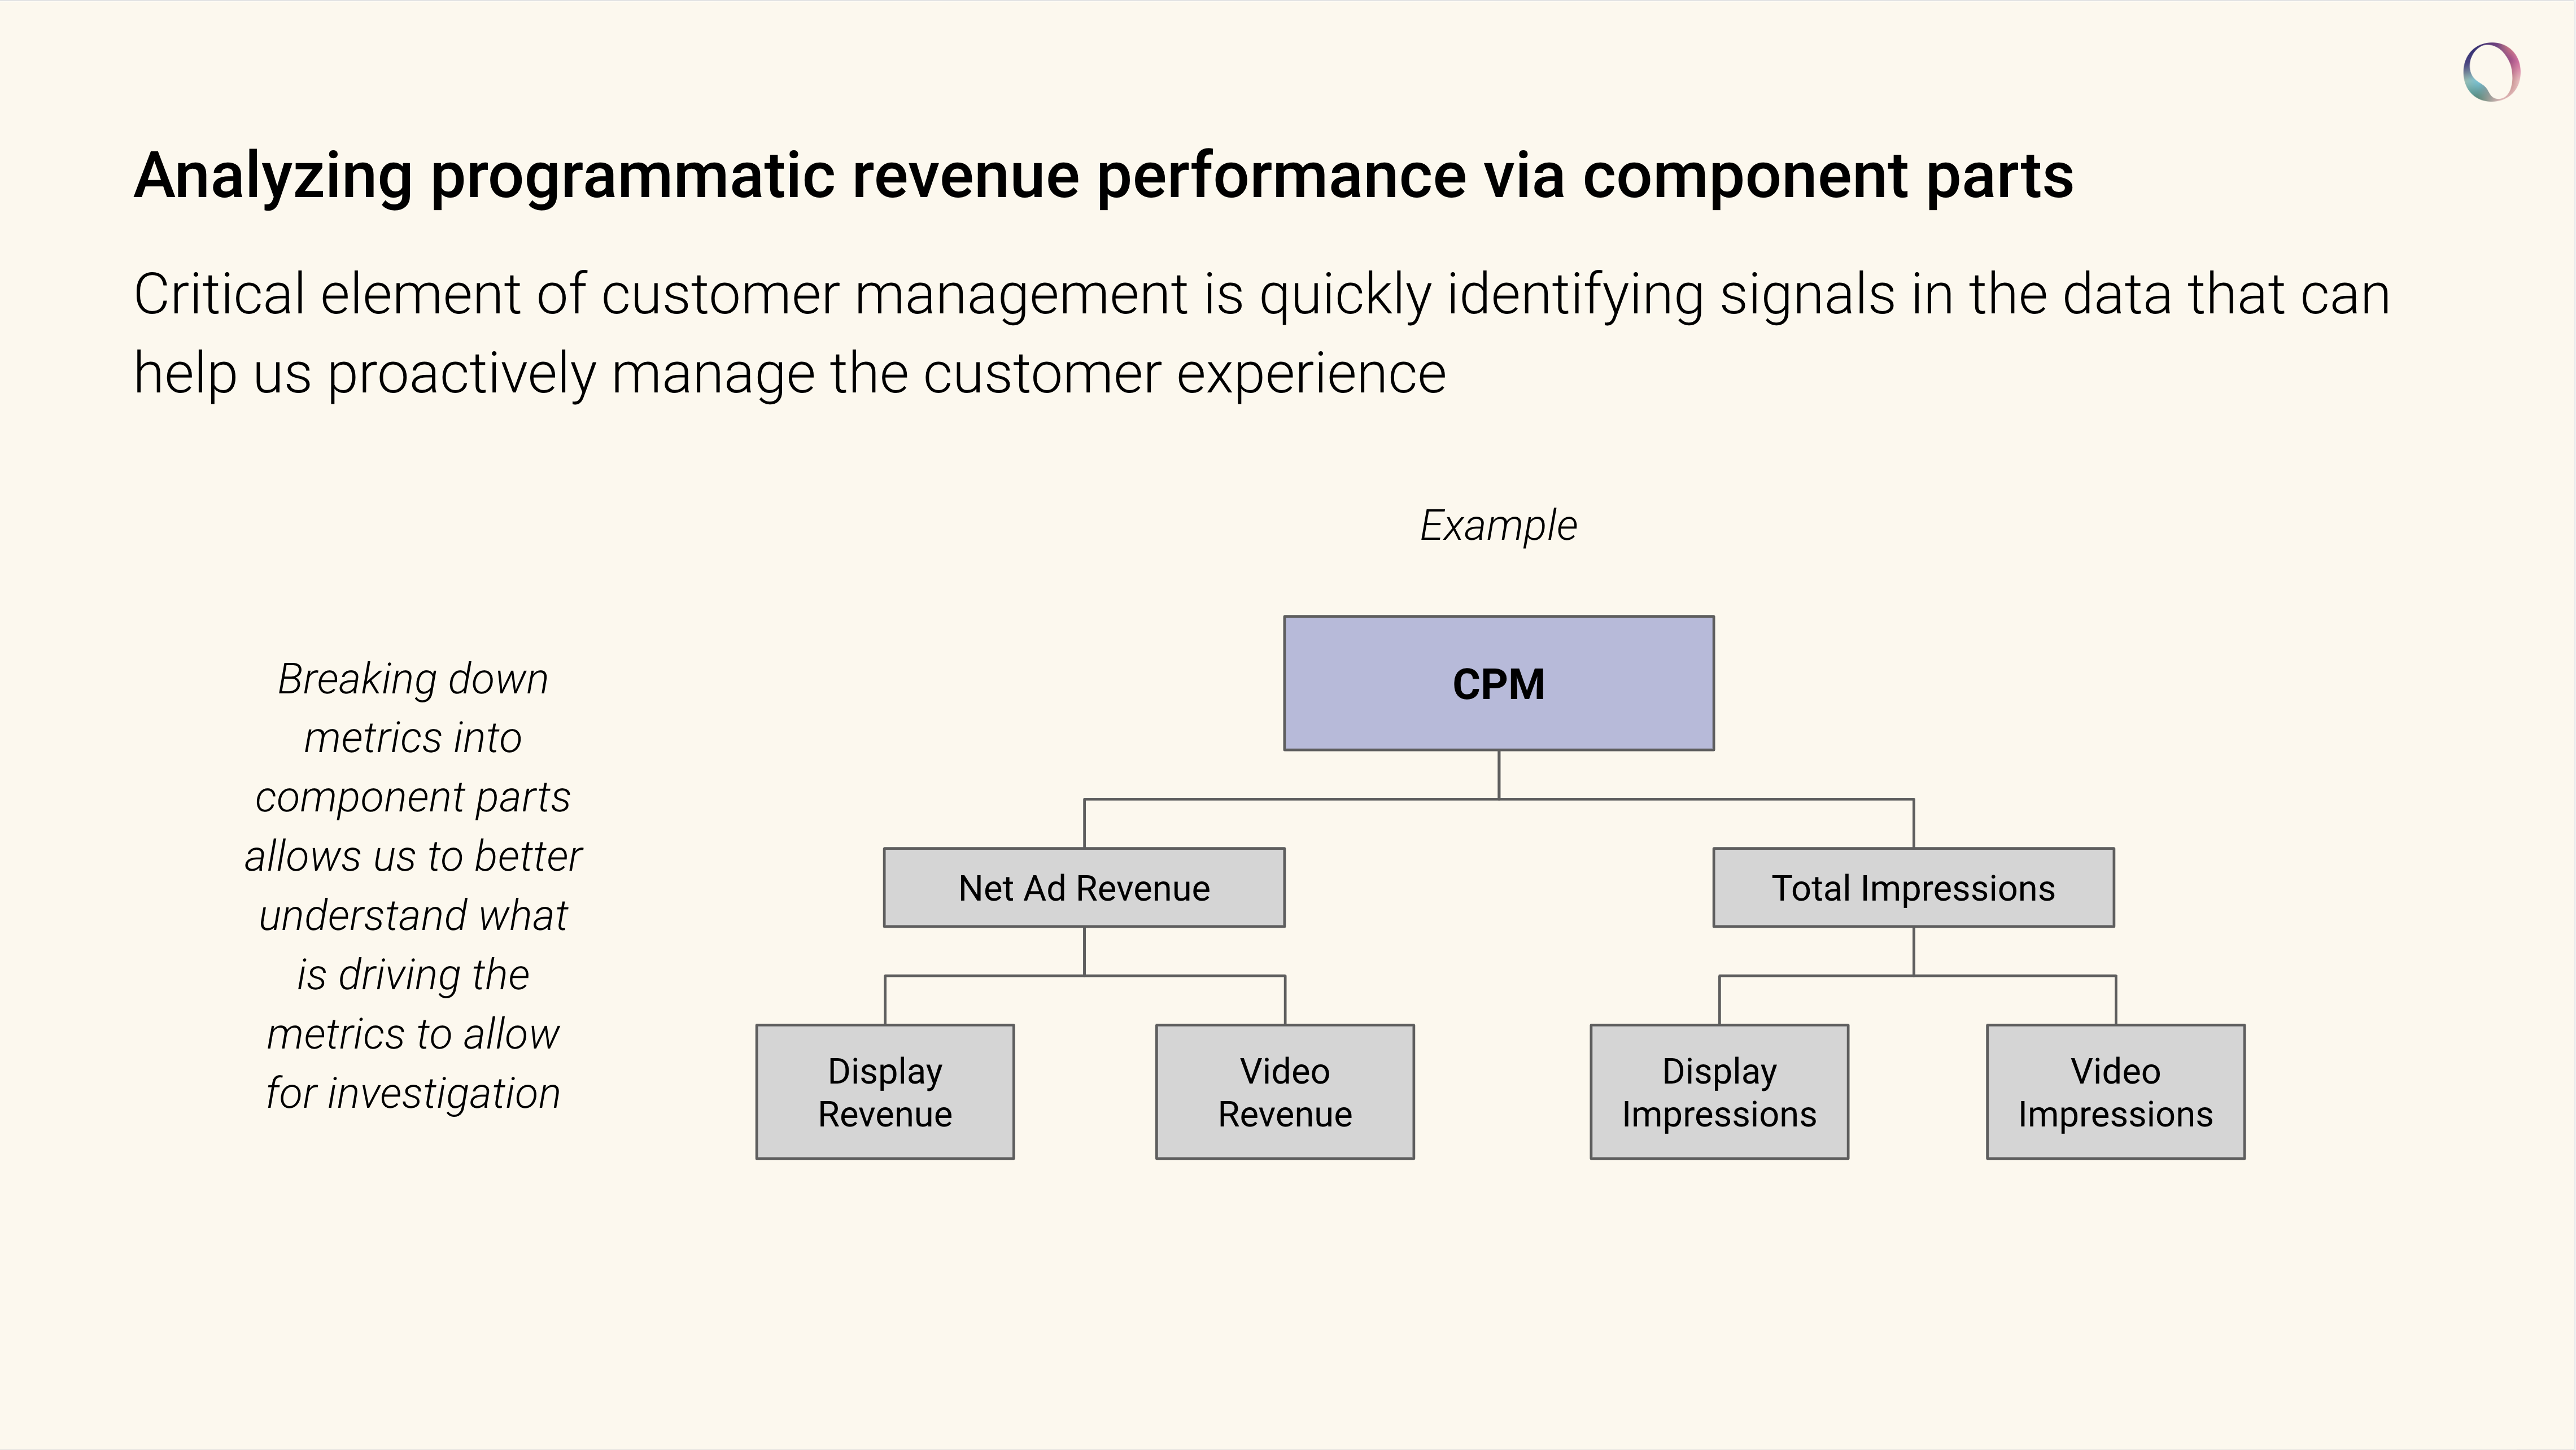
Key Takeaway #5: Break down revenue performance into component parts in order to take action
The best way to increase revenue sustainably is to break down each of the metrics into its component parts, and then optimize:

Take-home discussion questions:
Our goal with guides like this one is for publishers to feel confident answering questions about what is programmatic advertising revenue in front of investors, engineers, and advertisers. Too often editorial and revenue people lose each other in the fog.
- When you see CPM is going down, what does it mean? What should you investigate? What actions should you take?
- If RPM or RPS is decreasing, what are the three key metrics we should spot-check to figure out what is driving this? What actions would you take?
- If Net Ad Revenue is going down, what should we look at first to make sure something isn’t wrong?
Hit us up if you need the answers : )


